
carwow is the most convenient, stress-free way to find and buy a new car, at a price you can be confident in.
Overview
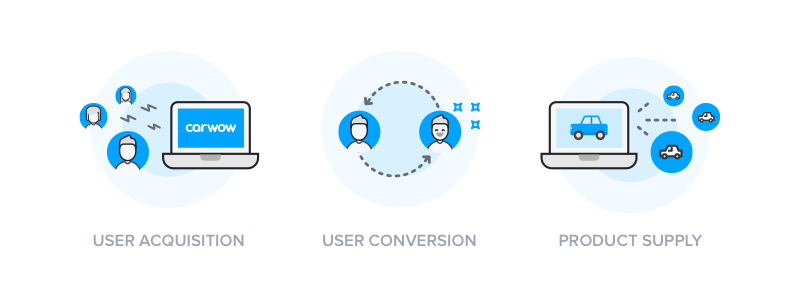
The Product Team at carwow is split into three squads: User Acquisition, User Conversion and Product Supply. The first two are focused on improving the car buying experience. The latter is aimed at dealers. Each squad has a product manager, designers, data analysts and software engineers.
I'm the lead designer for the Product Supply team, working on the dealer's platform where our partners are able to control their stock cars and keep in touch with customers.
Dealer Engagement Project
Dealers are essential to carwow. Thus, one of the main objectives for the Product Supply team, is to increase dealer engagement. Happier dealers means better performing dealers, which translates into more sales for them and more revenue for us.
Ultimately, we want them to use carwow as their default sale, leads and stock management software. Achieving that is only possible with a streamlined, easy to use platform.
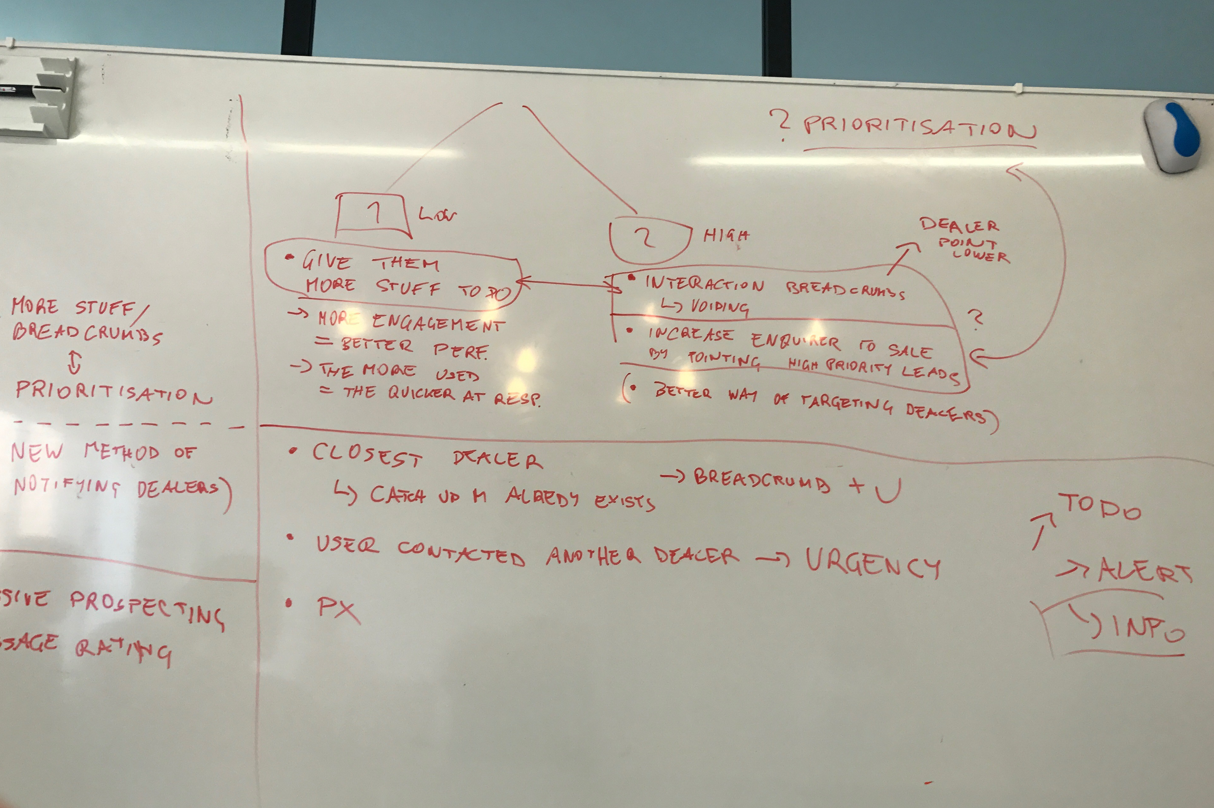
We kicked off the project with a discovery session where we were all invited to jot down ideas on how we could potentially attract dealers to use more our plaform. Although many of the proposed ideas were interesting, we concluded that most of them were based on assumptions rather than solid data. That's when we decided to combine quantitative data with qualitative data.
Empathizing
After discussing with the team, I came out with the idea of bringing the product closer to our users. At carwow, we have account managers that are in contact with dealers on a daily basis and hava a very good relationship with them. However, the Product Team had never used this as an opportunity to hold user reasearch nor testing sessions. So, to have a better sense of how we can improve the product as well as validating some of our assumptions, it would have been helpful to understand the mindset and background of dealers' behavior, needs and goals.
Together with people in the data team - who are the best people to work with if you need to learn analytical skills - we started by segmenting our users in order to easily target different problems for different cases, thus better understanding the audience for whom we were designing for. These are the main three categories we identified:
- Newly on-boarded dealers and Long-time user dealers
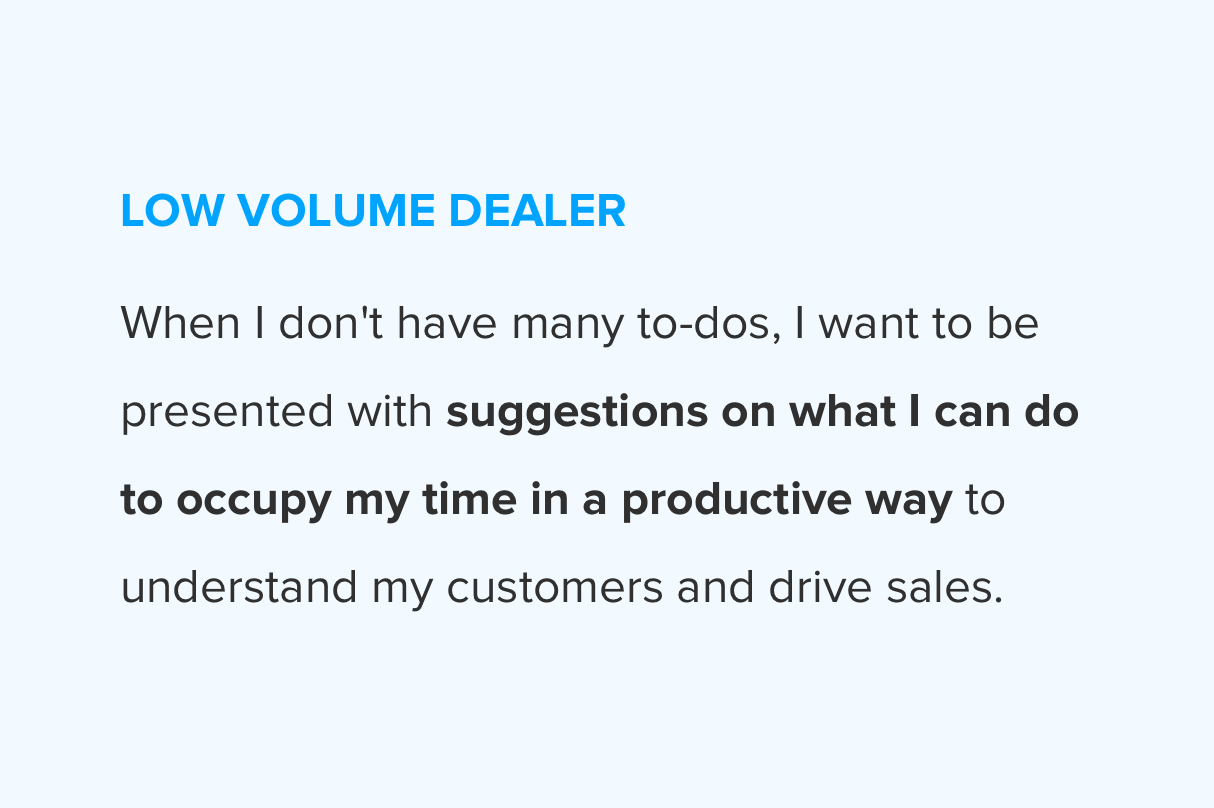
- Low Volume: High performing dealer and Low performing dealer
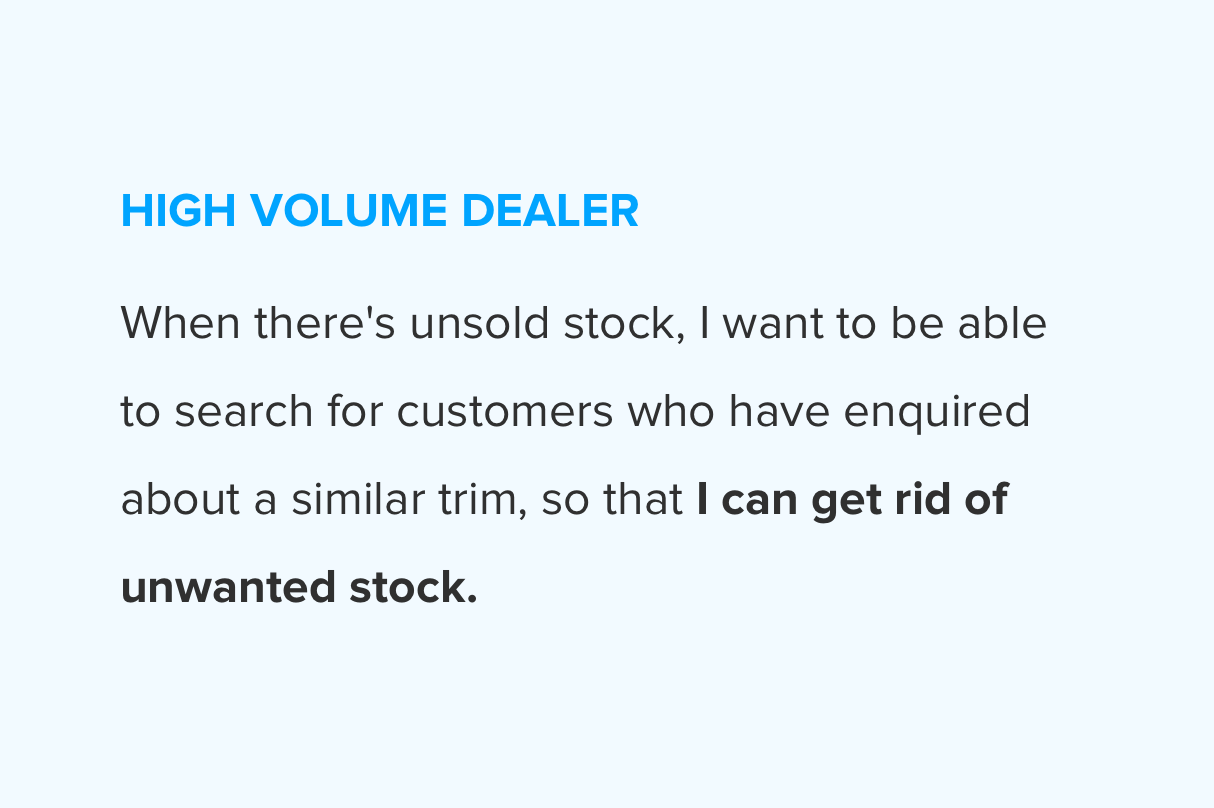
- High Volume: High performing dealer and Low performing dealer
Defining
I then started creating some Job Stories of possible users, situations, motivations, and outcomes by using the "Jobs to be done" model. Thanks to this approach, we were able to go back to our initial ideas and define what features really needed to be worked on. We also understood which features would have needed direct feedback from our dealers.
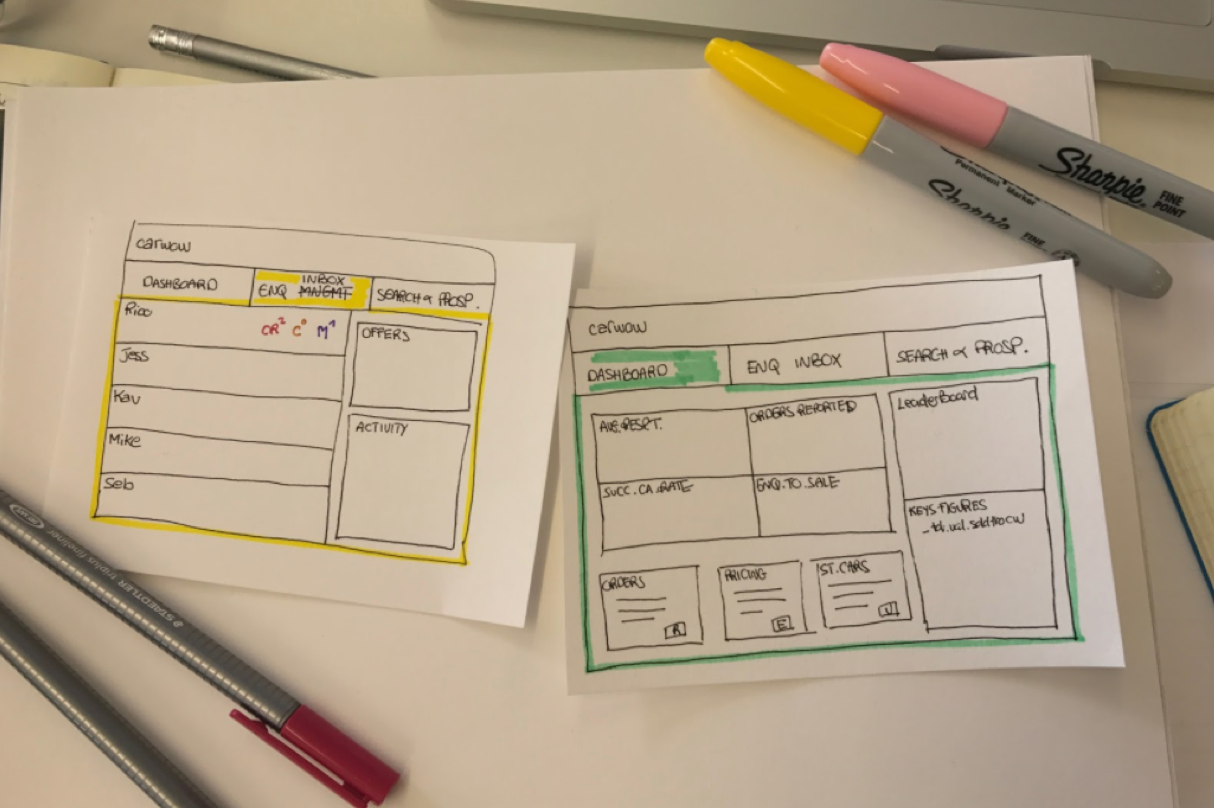
Ideating and prototyping
With that in mind I was then able to start sketching down some ideas - and also involved everybody in the team to sketch out with me - catering for the different conditions and situations. Once we were all finally happy with what we had, I then moved onto translating those concepts into wireframes in Sketch and made clickable prototypes on Marvel.
Testing
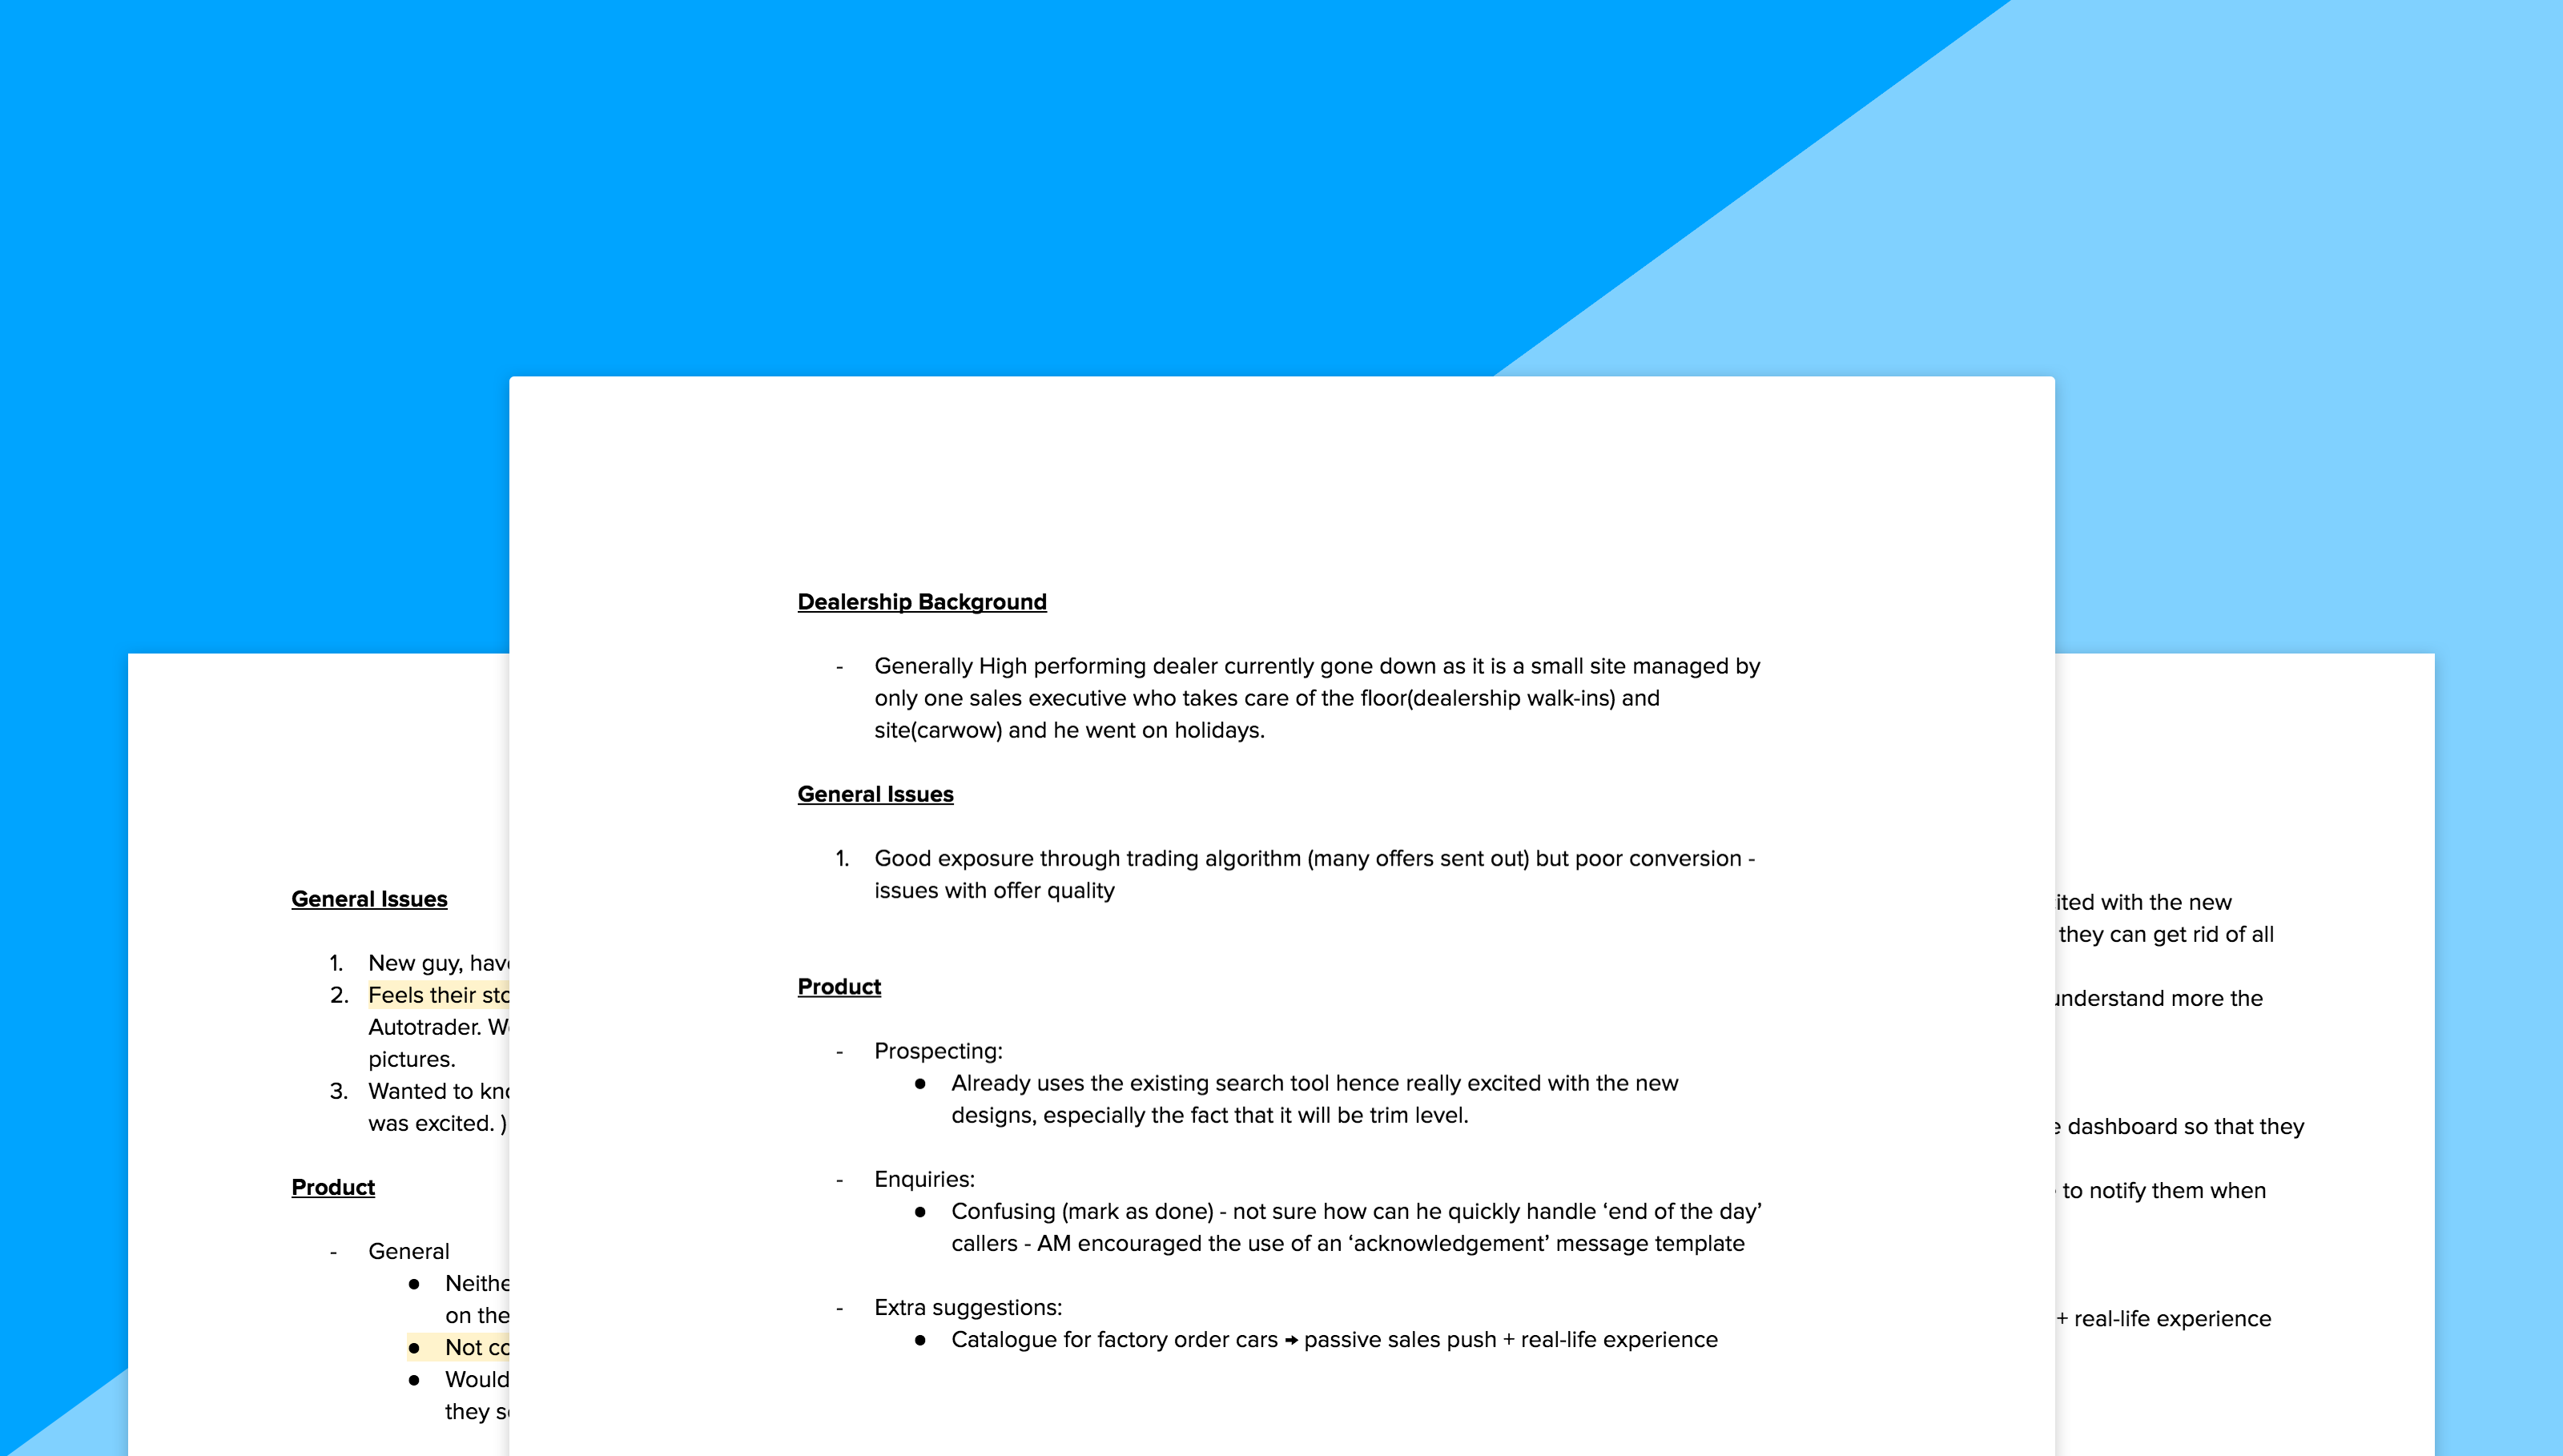
Thanks to the Account Managers' help, the whole team divided in pairs, started meeting different dealers either at their dealership or carwow office. We showed them our concepts and asked asked questions we had prepared in advance.
The outcome was really positive, and we were able to collect fantastic feedback that let us iterate on my protypes until we got to the final solution. There's nothing better than observing how real people deal with the product in order to design something meaningful.
The process I just described resulted in the creation of the following features:
Prospecting Tool
Since dealers can't always rely on customers to reach out, actively prospecting new leads is a crucial part of generating sales. This feature can help dealers searching for broader sets of users based on location or model by targeting every customer who has already received an offer from them.
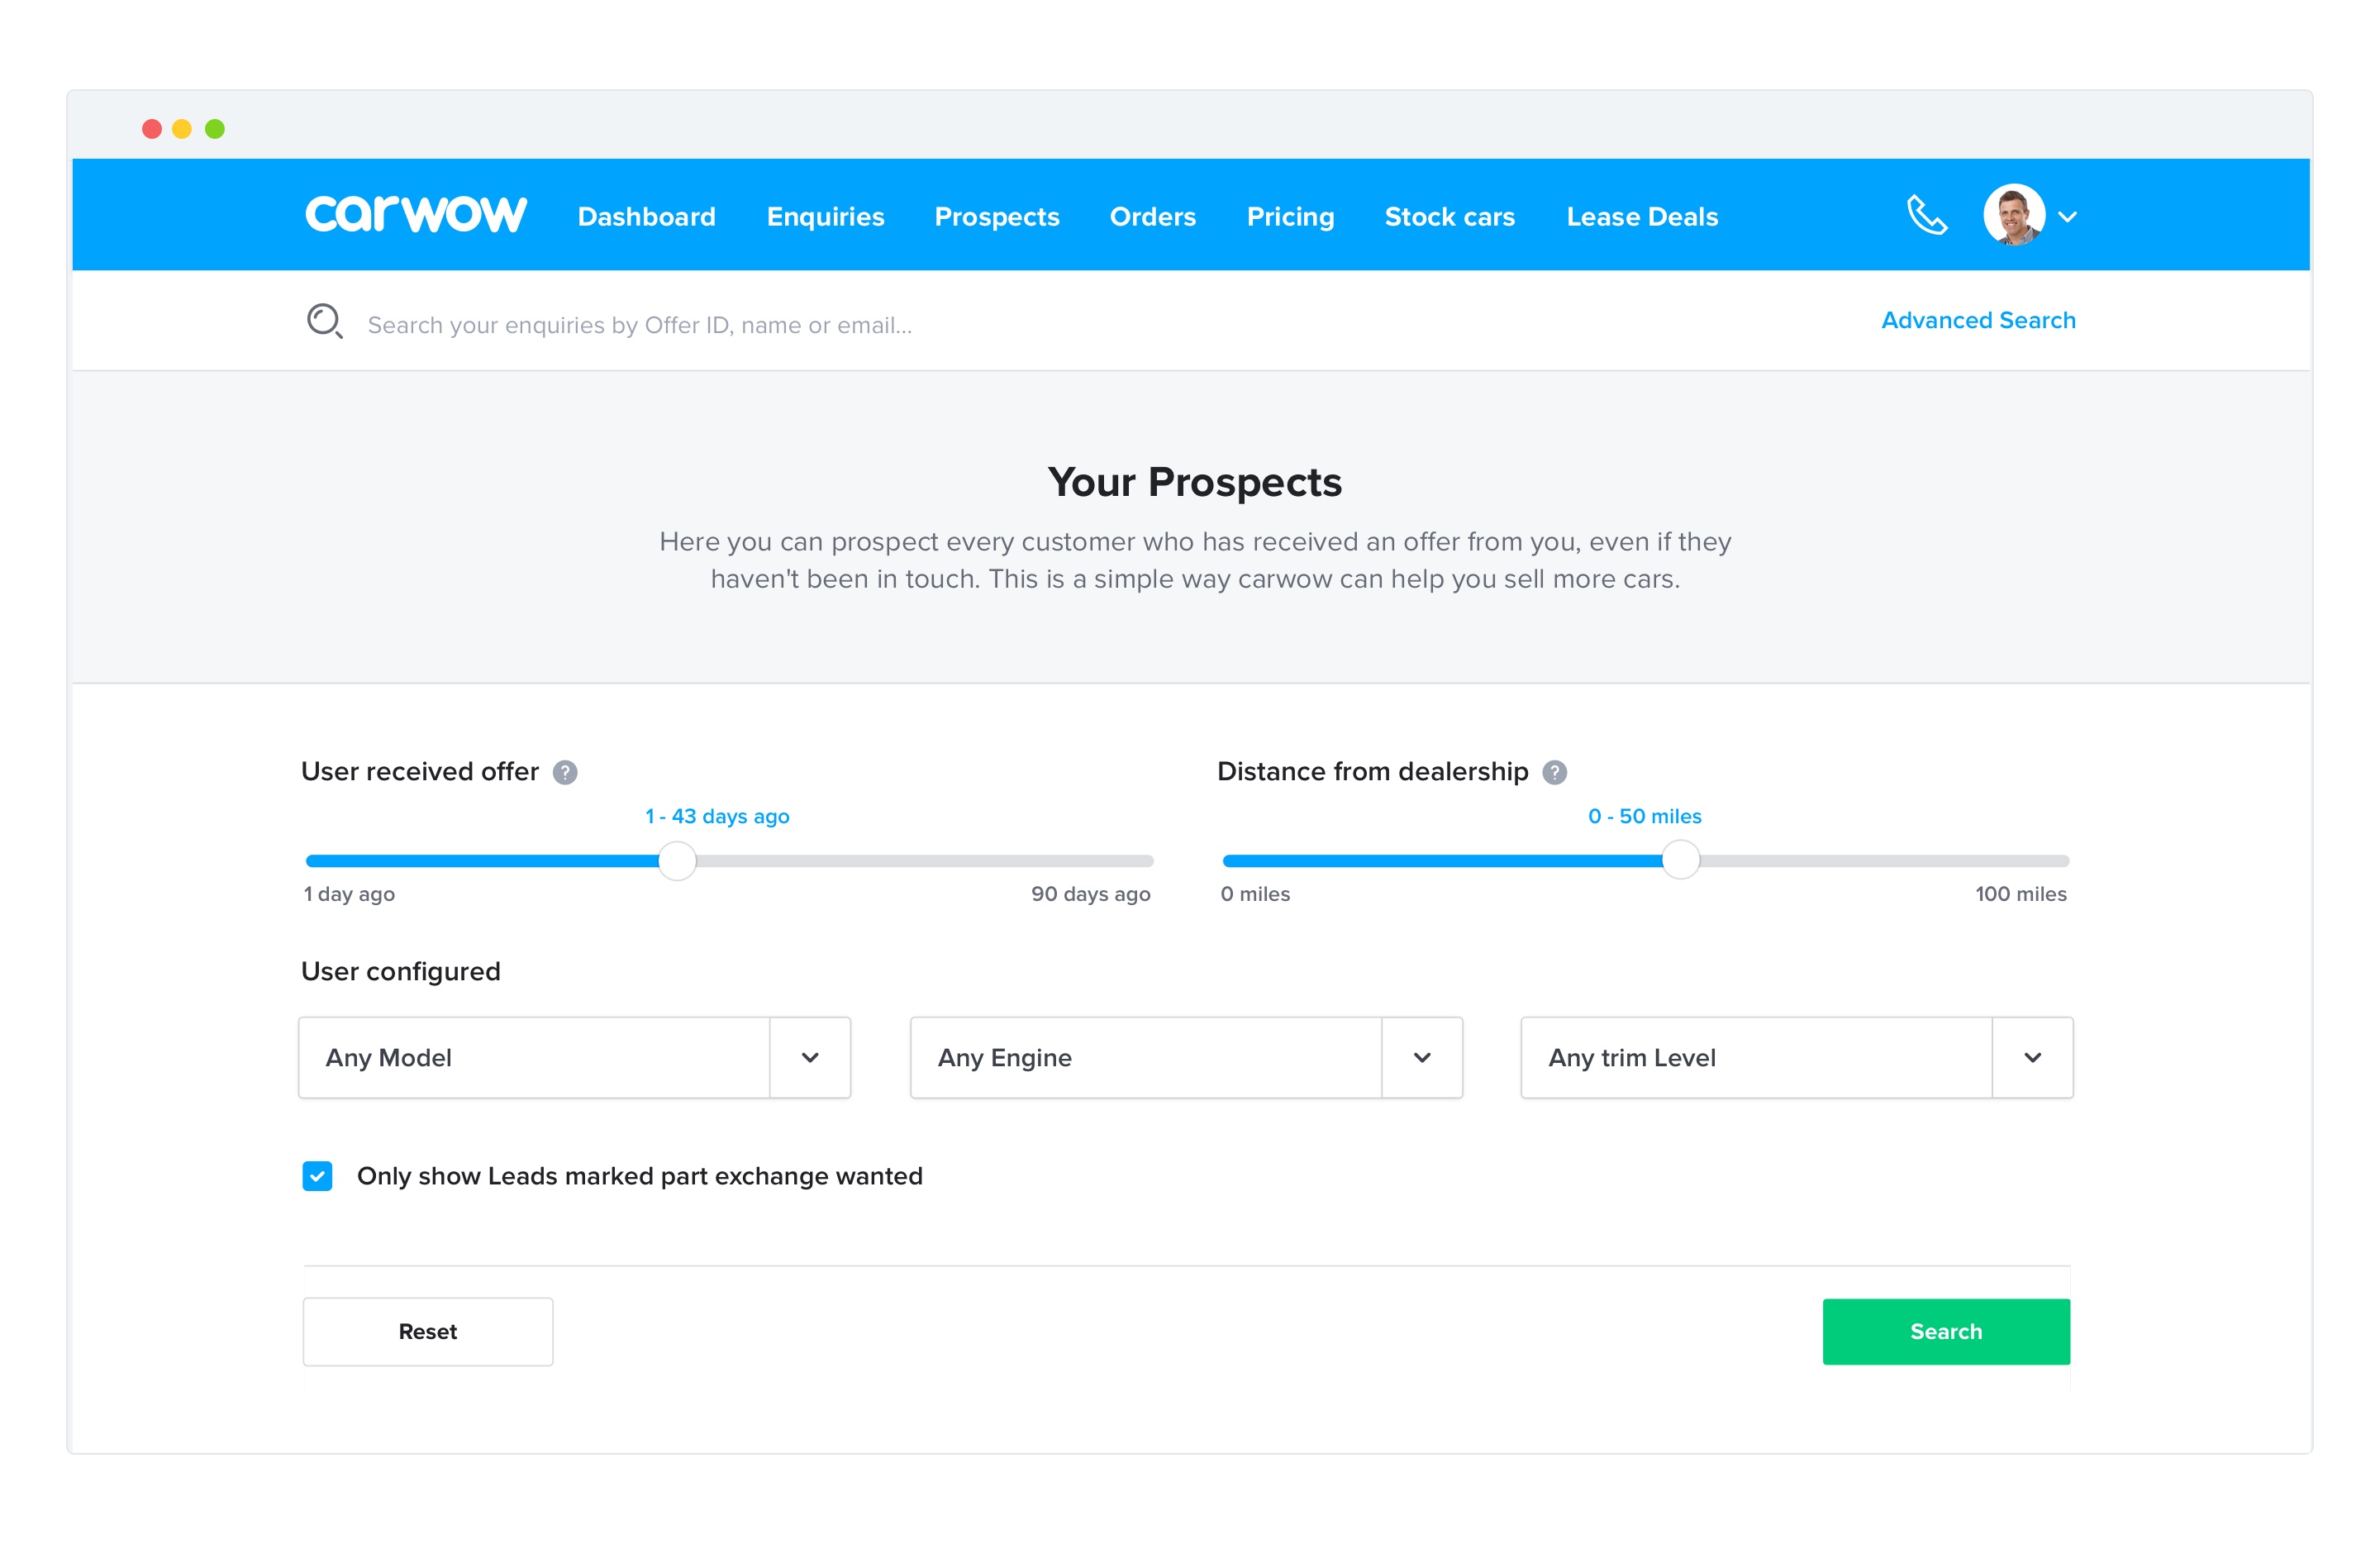
“Great feature! This is brilliant, works really well! I have been using it for well over an hour now. Thanks for implementing it. ” Dealer feedback
Customer satisfaction
Users have been able to rate dealers' messages as helpful or unhelpful. However, we weren't yet doing anything meanigful with this information. That's why we decided to show it to the dealers on their dashboard as well as on their message threads with users.
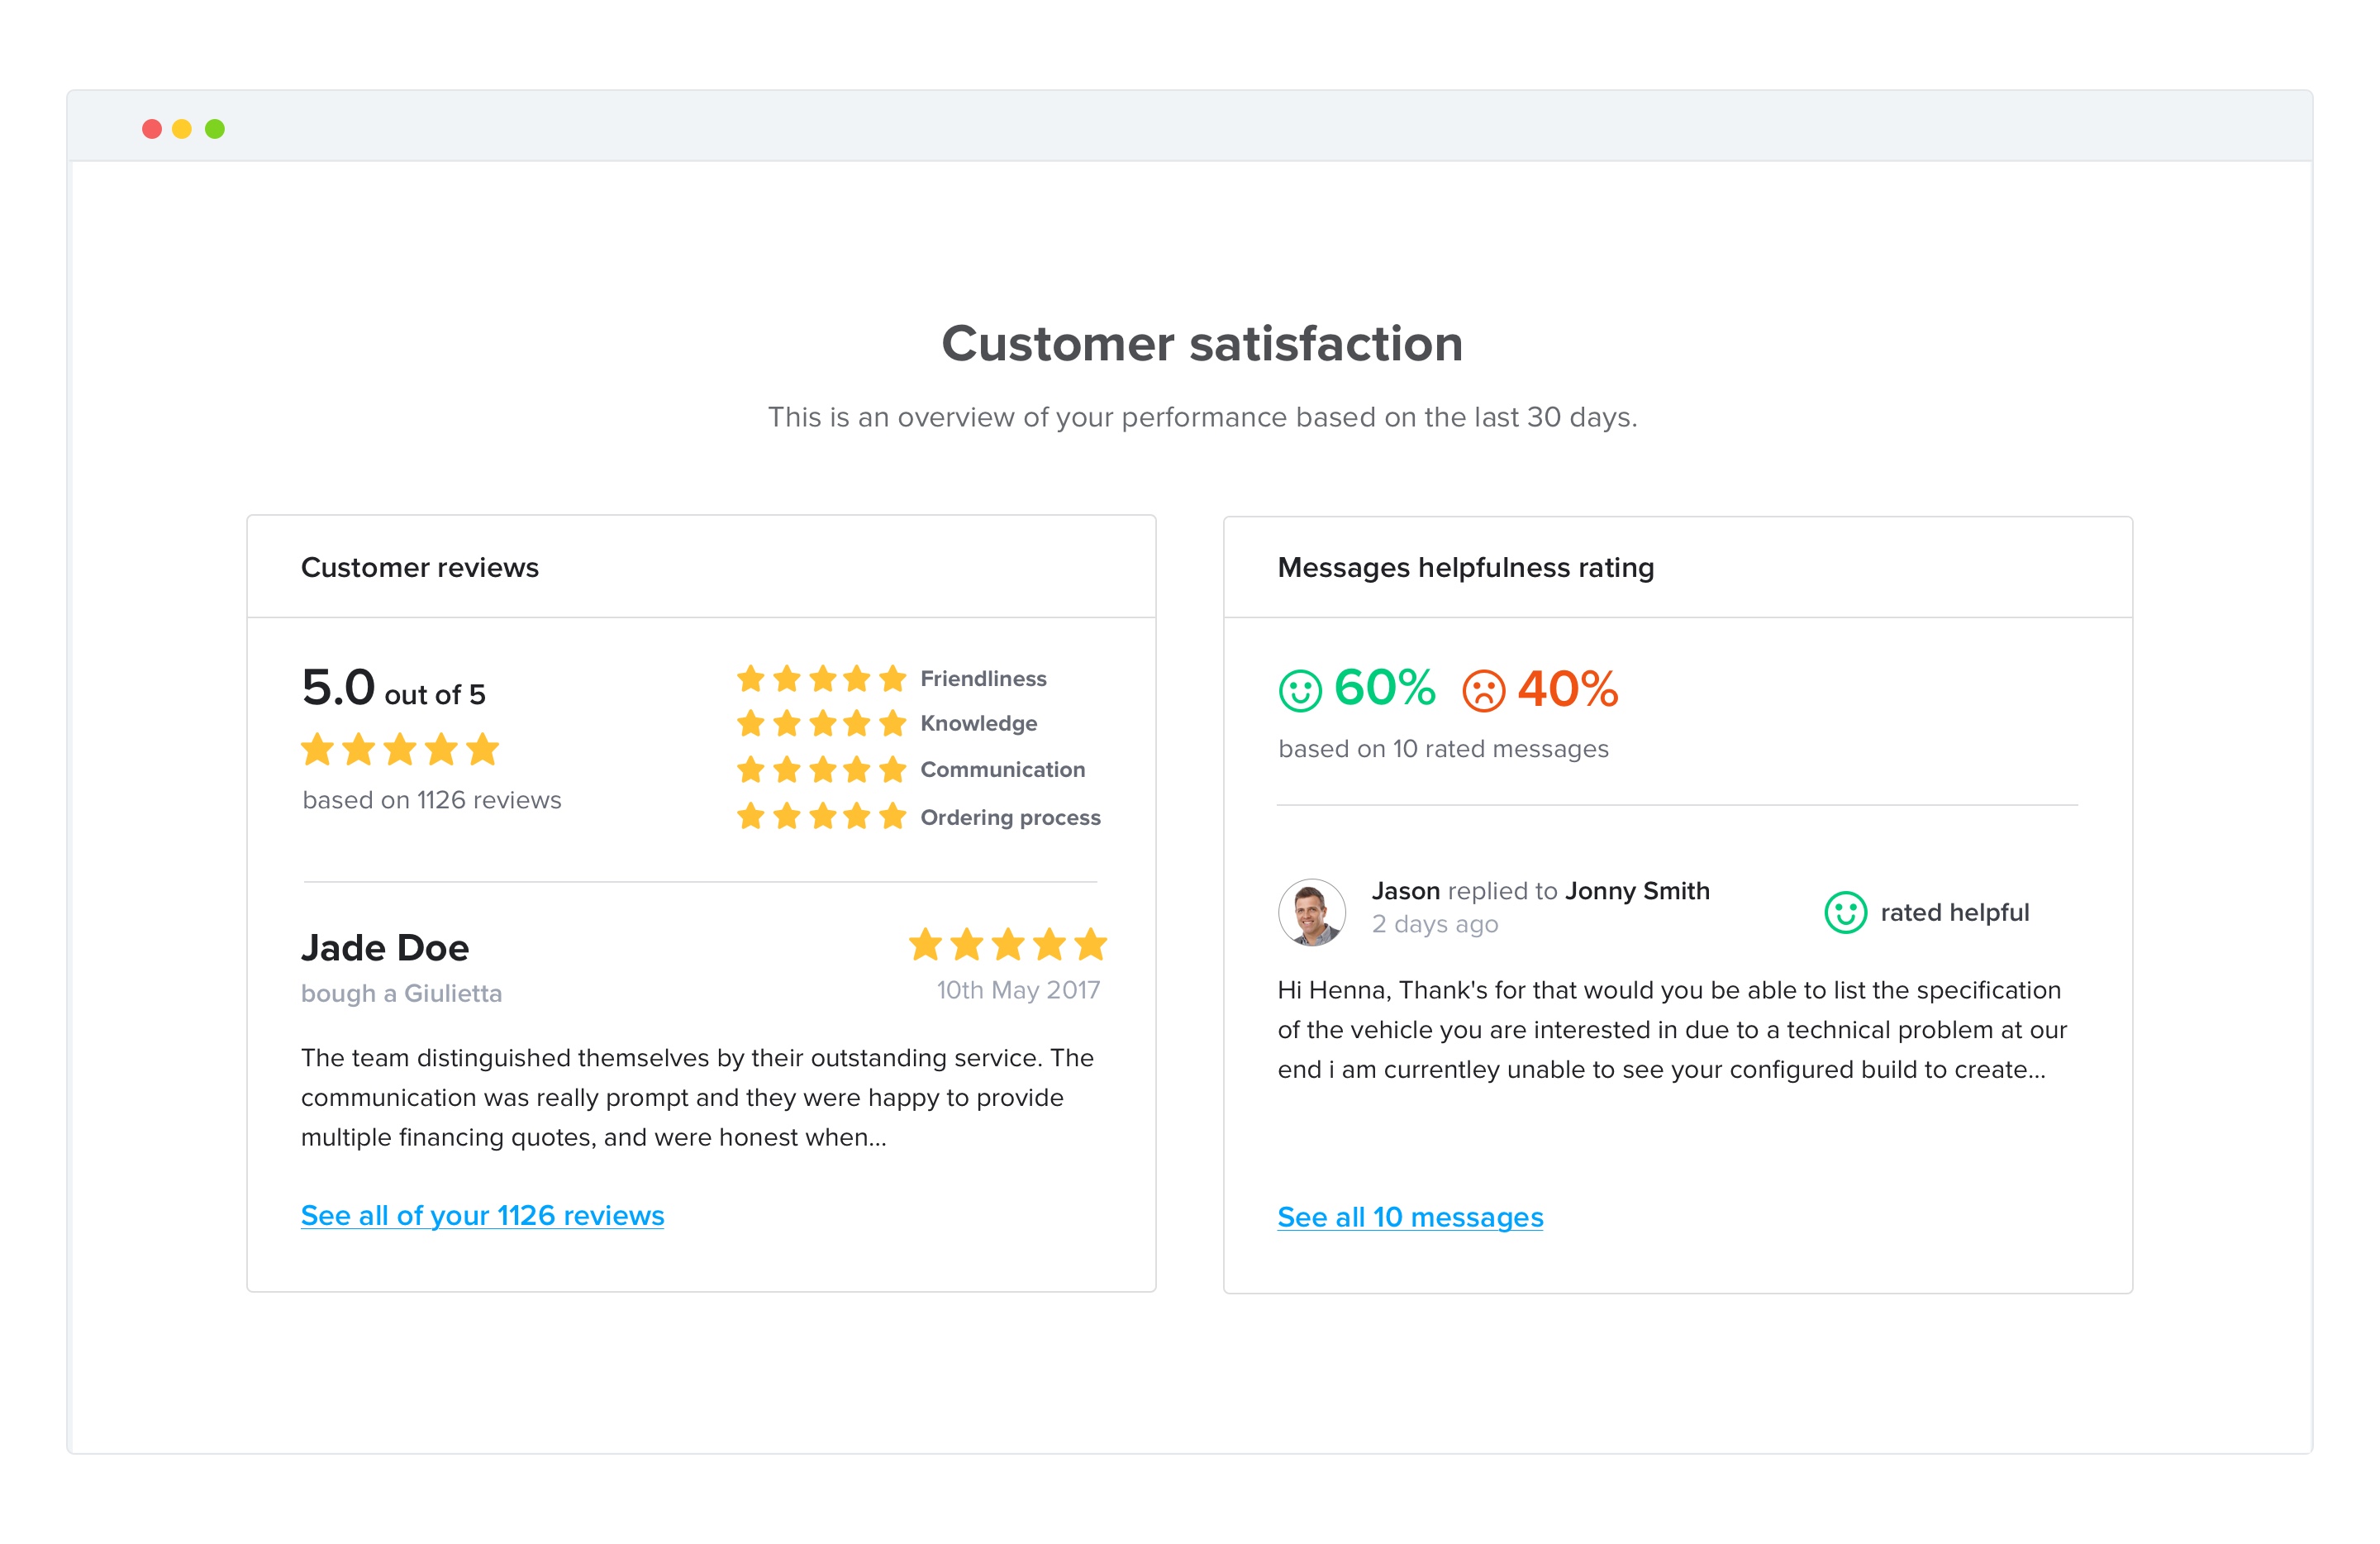
By making more visible what is considered a helpful (or unhelpful) message, this feature proved to be a learning tool for dealers and is helping them improving their overall customer handling process. Everyone loves to see an excellent customer service score, so this is the perfect way to turn enquiries into sales.
Sales Graph
This is a very insightful feature that lets dealers get a grip on their conversion rate by showing them their enquirer and sales numbers over the last 30 days.
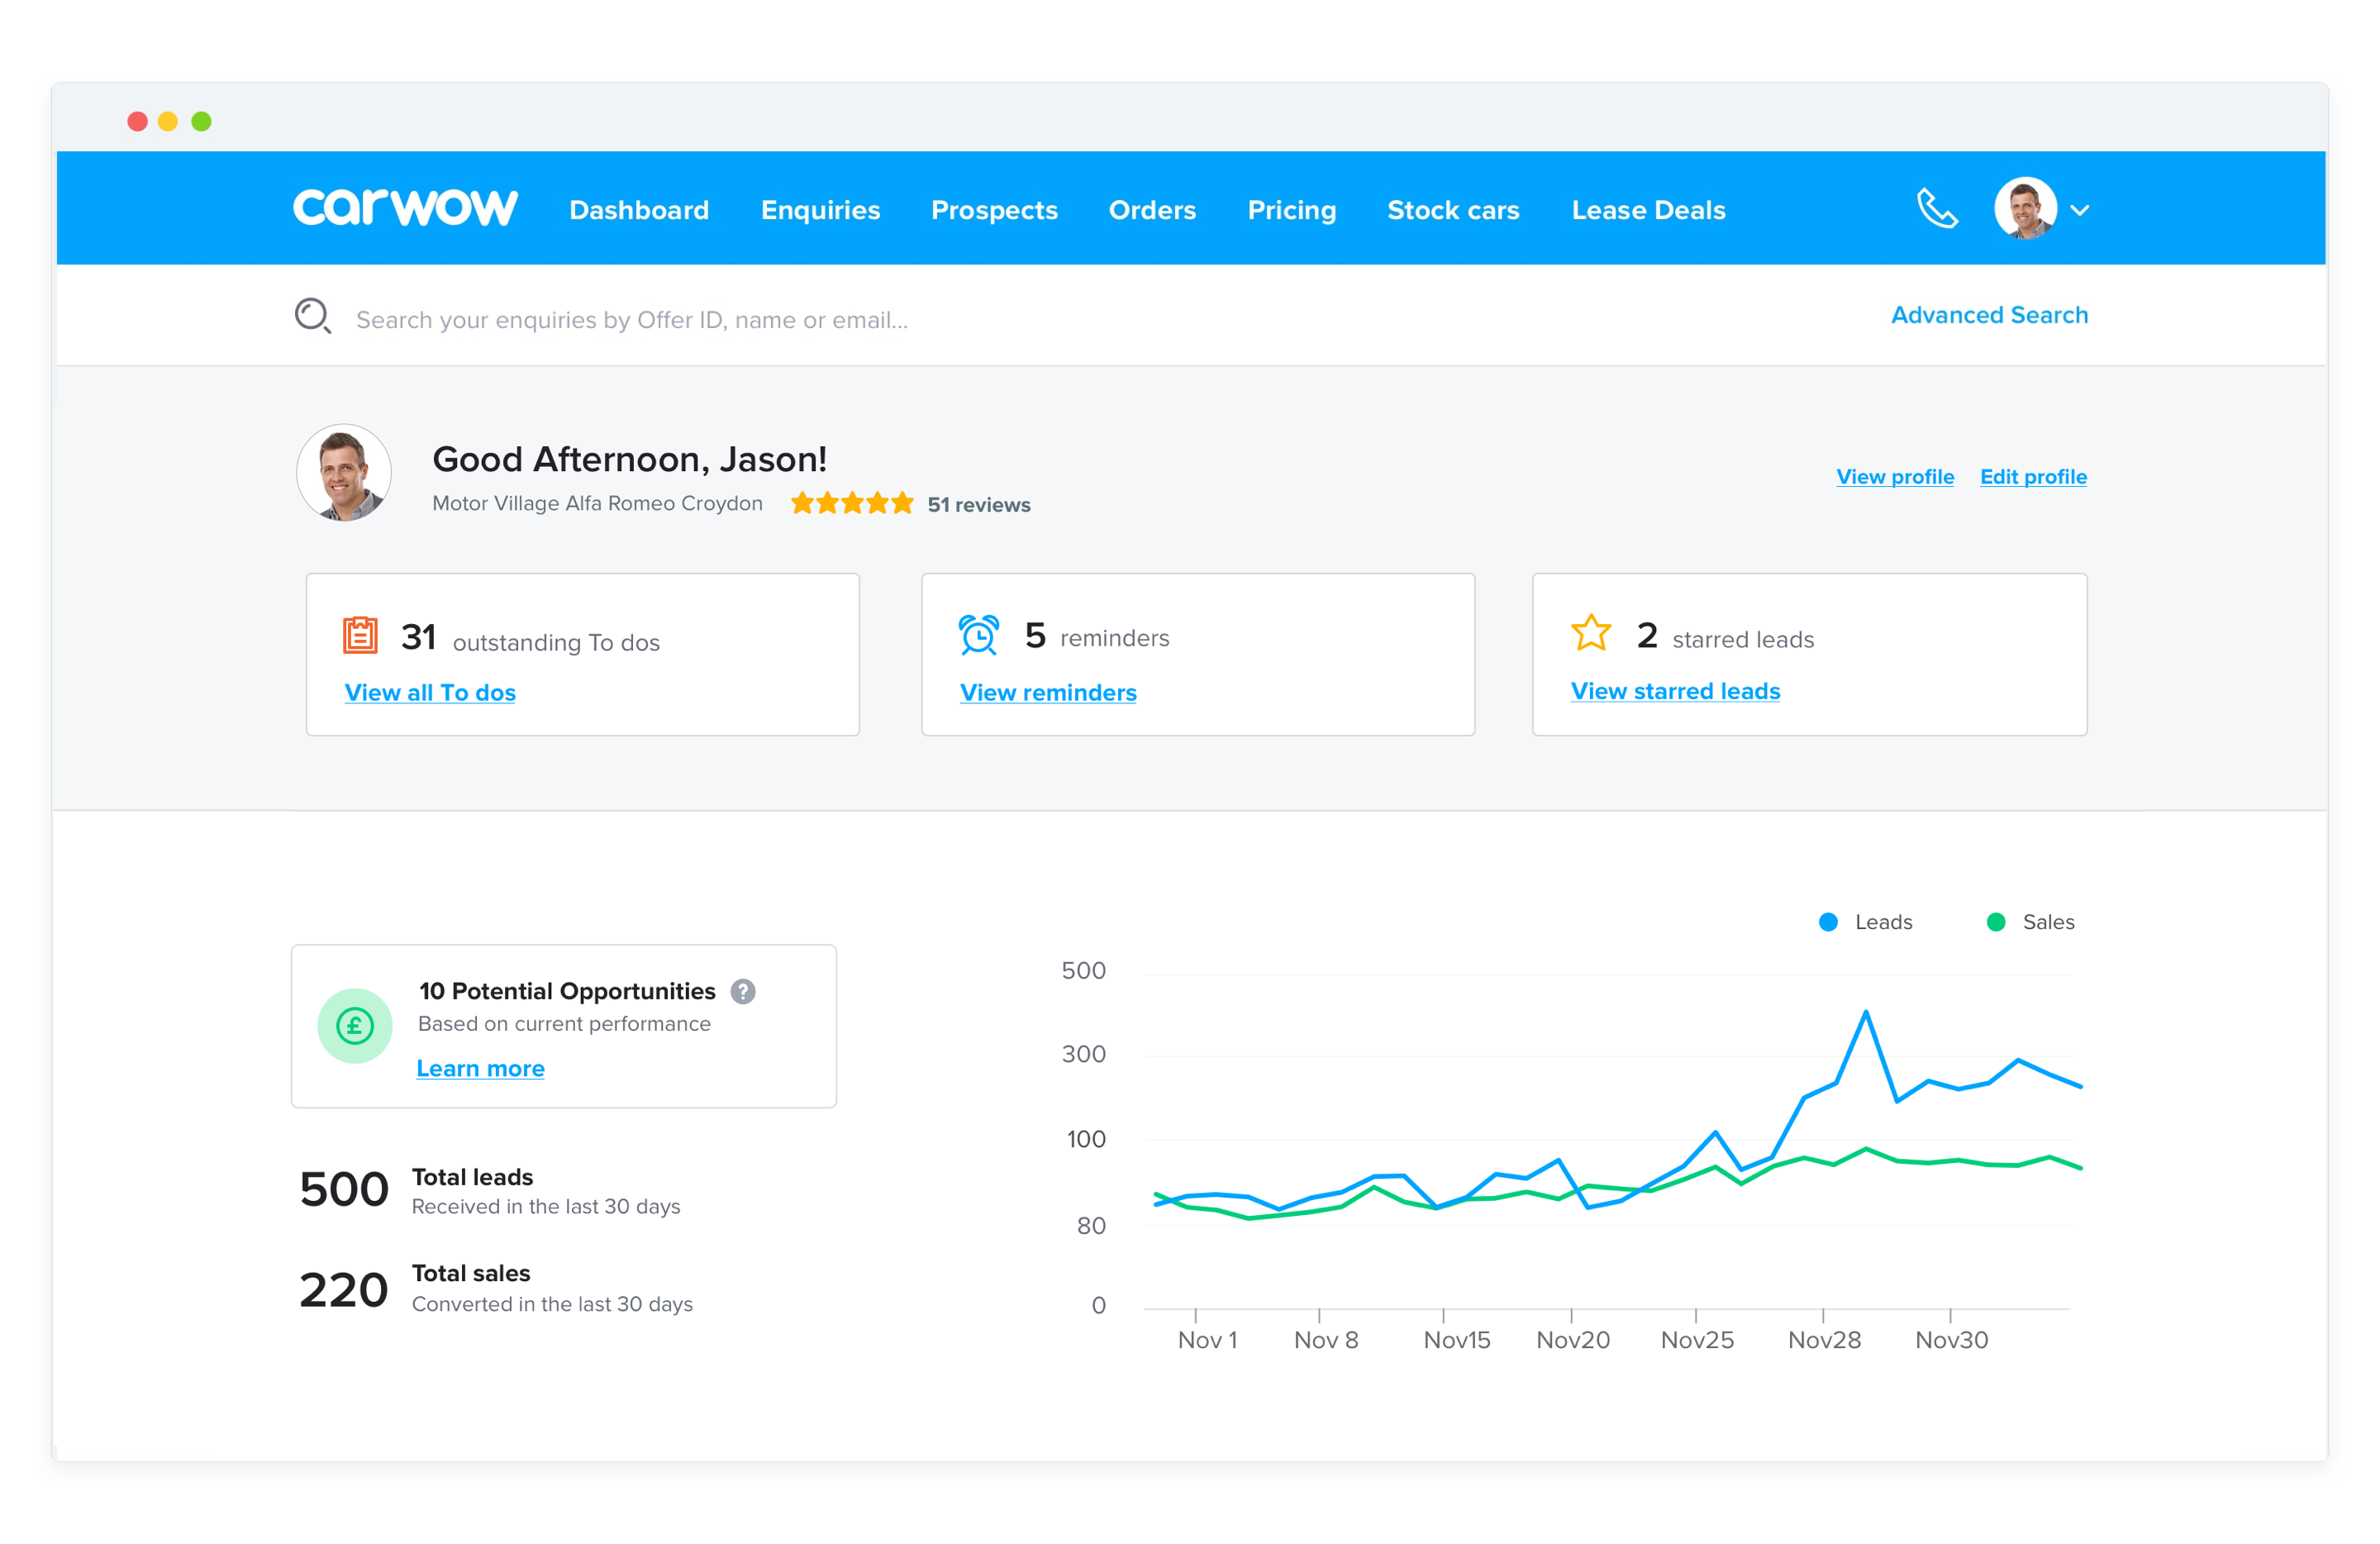
For underperforming dealers we're also showing a section with their potential missed sales.
The idea behind this is to take the science out of the enquirer to sale metric and clearly highlight what sales opportunities they are missing by not converting enquirers as well as they should. This is helping motivating dealers to perform better.
League Table
We wanted to add a gamification element to dealer metrics and decided that the best way to do it was to make dealerships compete between one another by giving them clear benchmarks for good performance. This proves useful, especially for Head of Groups, to keep tabs on all their dealerships and easily see how they’re doing relatively to each other.
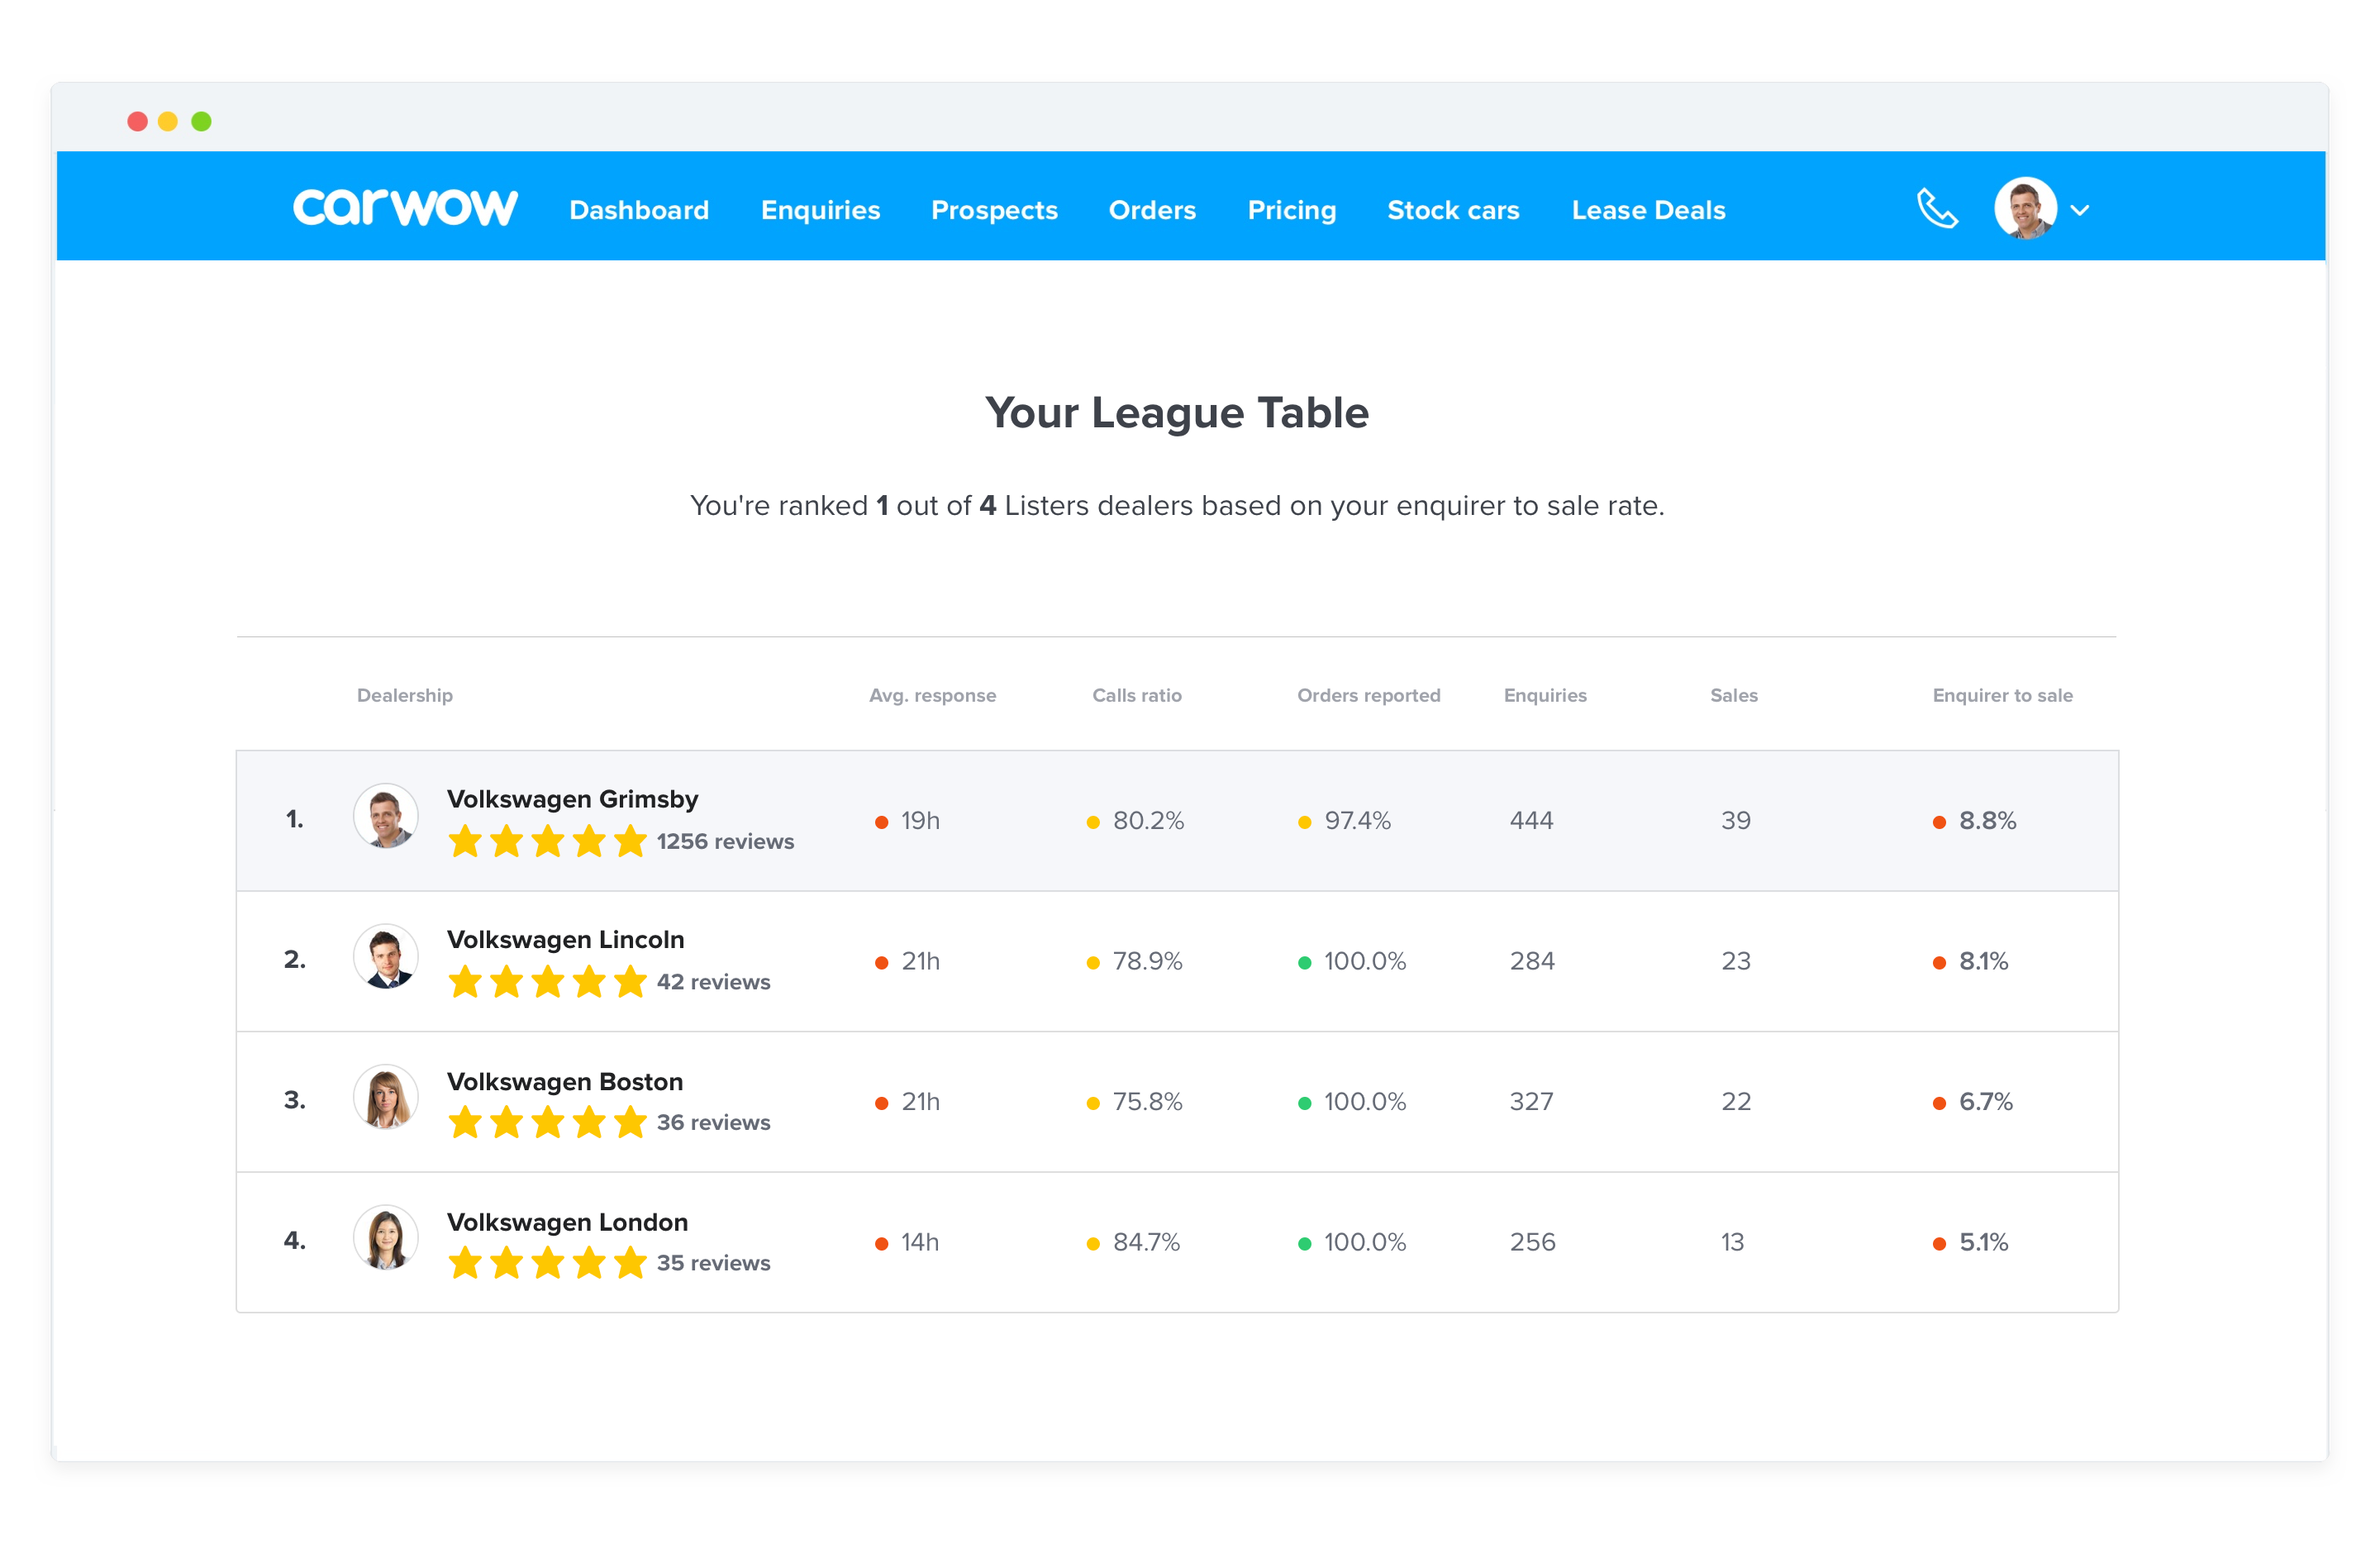
The League Table also boosts competitiveness. Some people need to see themselves winning at the top of the league, some need a cuddle and support to get out of mid table and some need a fire lighting under them to drive them out of relegation.
The results
After launching these features we saw that engagement on the site increased by over 60%. Moreover, all dealers on the platform improved their performance by an average 45%. Even the worst performers pulled their socks up and increased enquirer to sale ratio by an average 10%.